Generation of Pressure–Entropy (P–S) Envelope for a Pure Component Using PTENVELOPE Analysis in Aspen Pl
Project Description
Thermodynamic phase envelopes are essential tools for understanding the phase behavior and energy relationships of pure components. This project demonstrates the systematic generation of a Pressure–Entropy (P–S) envelope using Aspen Plus analysis tools. Although Aspen Plus does not provide a direct one-click option for P–S curve generation, the PTENVELOPE analysis
combined with custom property sets enables accurate construction of the required thermodynamic diagram.
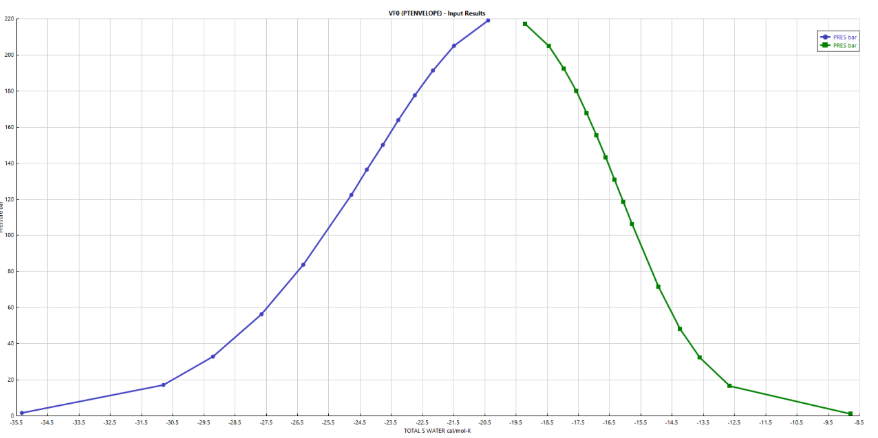
The model is developed using water as the pure component and the Soave–Redlich–Kwong (SRK) equation of state as the selected property method. A customized Property Set is created to calculate entropy (S), which is not automatically included in standard envelope outputs. Two separate PTENVELOPE analyses are performed: one representing the bubble point curve (vapor fraction VF = 0) and the other representing the dew point curve (VF = 1). These two curves collectively define the two-phase boundary region.
After running both analyses, results are visualized through custom plotting tools. Entropy is plotted on the X-axis and pressure on the Y-axis. The dew and bubble curves are combined into a single graph using the “Add Curve” functionality and unified Y-axis mapping. The final output is a complete Pressure–Entropy envelope representing phase equilibrium boundaries for the pure component.
Optimization Strategy
The optimization strategy in this study focuses on ensuring thermodynamic consistency and accurate property evaluation. Selection of an appropriate equation of state (such as SRK) is essential for reliable vapor–liquid equilibrium calculations. Additionally, careful configuration of the Property Set ensures entropy values are calculated and tabulated correctly during the PTENVELOPE analysis.
Graphical optimization is achieved by properly merging dew and bubble curves into a single plot and aligning axes for clarity. This structured approach improves interpretability and enables further thermodynamic assessments, such as evaluating turbine expansion paths, compressor processes, or refrigeration cycles directly on the P–S diagram
Thermodynamic Property Modeling Using SRK
The Soave–Redlich–Kwong (SRK) equation of state is applied to model vapor–liquid equilibrium behavior. It provides reliable phase behavior predictions for pure components and light hydrocarbon systems.
PTENVELOPE Analysis Configuration
Two PTENVELOPE analyses are required:
● Bubble point curve (VF = 0)
● Dew point curve (VF = 1)
Each analysis specifies flow rate and vapor fraction, with entropy included via a custom Property Set.
Custom Plot Construction and Curve Merging
Custom plotting tools are used to define entropy as the X-variable and pressure as the Y-variable. The “Add Curve” feature merges dew and bubble lines, and Y-axis mapping ensures
both curves share a single axis for proper visualization.
Projects Insight
Indirect Generation of P–S Curves
● No direct one-click option available
● PTENVELOPE analysis enables workaround
● Custom property set required
Importance of Entropy Property Set
● Entropy not default in envelope output
● Must be manually defined
● Ensures accurate thermodynamic plotting
Bubble and Dew Curve Construction
● VF = 0 defines saturated liquid boundary
● VF = 1 defines saturated vapor boundary
● Together form phase envelope
Graphical Data Handling
● Custom plotting required
● Curve merging via “Add Curve”
● Axis mapping improves clarity
Engineering Applications
● Useful for turbine and compressor analysis
● Supports refrigeration cycle studies
● Assists in thermodynamic education
Model Flexibility
● Applicable to any pure component
● Extendable to other EOS methods
● Adaptable for advanced property analysis
Conclusion
This project demonstrates a structured method for generating a Pressure–Entropy (P–S) envelope in Aspen Plus using PTENVELOPE analysis and custom property sets. By combining bubble and dew point analyses and employing advanced plotting tools, a complete
thermodynamic phase boundary diagram is constructed. The methodology provides engineers with a practical approach for thermodynamic visualization and analysis, supporting energy system design, phase behavior studies, and advanced process modeling applications.